Turning one piece of content into 14 posts is much easier than looking for, reading and sharing 14 different pieces of content.
Most people are not maximizing content posting and sharing because they either don’t create original content and aren’t comfortable with how to position someone else’s content.
The intent behind posting and sharing content is not to create noise and blabber on and on. The intent is to add insight to your network, increase your visibility and showcase your expertise.
Or, maybe they have original content, just not enough of it. During a recent coaching session, my client mentioned he was running out of content. That’s not what I usually hear, so I encouraged him to try breaking the content into multiple posts over a given timeframe.
Infographics are RICH in content, super visual and easy to consume.
Find an infographic relating to your industry or area of expertise, review it, determine if each statistic or quote is worth posting and then write a short introduction for each post. (Don’t forget if you are posting on Twitter your introduction needs to be less than 140 characters.
Tips to get ready:
- Go to bitly.com and shorten your URL link so it takes up fewer characters. There are other shorteners, too.
- Want to create additional images for the additional posts? Go to canva.com, create an account and get creative. If you need more capabilities check out Canva for Work.
- If you want to be super organized, you can schedule your series of posts on Buffer (my favorite) or Hootsuite. There are others but you will be fine choosing either one of these.
Here’s an example of an infographic from DDI that has 14 potential posts.
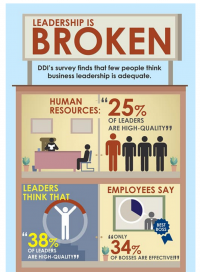
Post 1: DDI’s survey finds that few people think business leadership is adequate. Thoughts? http://bit.ly/2cnHnDH
Post 2: HR says that only 25% of leaders are high-quality. Time to make sure our leaders are trained to be great.
http://bit.ly/2cnHnDH
Post 3: Leaderships says that 38% of leaders are high-quality. Are they giving themselves the benefit of the doubt? http://bit.ly/2cnHnDH
Post 4: Employees says that only 34% of their bosses are effective. How’s your boss doing? http://bit.ly/2cnHnDH
Post 5: Only 49% of employees say they are working for the best manager they’ve ever worked for. http://bit.ly/2cnHnDH
You get the idea, right? Posts six through fourteen are going to follow the same pattern. Note that this infographic also includes a PDF version and a call-to-action at the bottom. Those could also be additional posts.
Space these posts out over two or three weeks.
And, don’t forget to include a link into any of your social, LinkedIn or email messages. Why? You want to add value to the people with whom you are communicating.
You can do this with any content that has statistics, quotes, benefits, etc. How about it? Will this make your content go further, help you curate more effectively?
Try this over the next month or two and let me know how it works for you.
Additional blogs you might be interested in:
- 11 New Tips for Publishing Content on LinkedIn
- Should Marketing Support Your LinkedIn Efforts?
- CEOs: Your Social Savviness is Good for Business
Check out our LinkedIn Company Page for updates and articles we find interesting and relevant or our Tools Page for complimentary resources.